
Friday, December 27, 2013
Positions of the Continents Interactive
Friday, December 20, 2013
What the hail? - Animation Shows the Role of Updrafts

Right: This hailstone is the largest ever verified in the USA: 8.0 inches in diameter, 18.5 inches in circumference, and 1.9375 pounds. It fell near Vivian, South Dakota in 2010. Lee Scott, who collected the stone, planned to make daiquiris out of the hailstone but decided to put in a freezer before taking it to the National Weather Service for certification (source: Weather Underground). CLICK HERE for more great hail trivia from Weather Underground, including an aerial photo of a town that received 18" of hail in one storm!
Also, CLICK HERE to see an impressive satellite view of the Hi-Line (north-central Montana) before and after a 2007 hail storm.
To view a convenient list of all the resources that have been posted on this "Earth Science Guy" blog site, CLICK HERE.
Below: Map courtesy of the Insurance Institute for Business and Home Safety - CLICK HERE to see a larger version of the map.

Friday, December 13, 2013
64-yard Field Goal in Denver's Thin Air

In 2003 Helena High's Dan Carpenter kicked a school-record 53-yard field goal on a warm, sunny, Saturday in October. Arguably that kick earned Dan a scholarship - and today he is the kicker for the Buffalo Bills. To get things started, I tell students about Dan's kick and ask them why that day and that location (Helena) were favorable for kicking the long field goal (there was no wind). As it turns out, on a warm day at high altitude air molecules are more spread out, resulting in less friction on the ball (fewer collisions) as it travels through the air. Interestingly, the density of the air in Denver is only 82% that of air at sea level. To learn more about this go to this web page.
Greatest Kicks in the NFL
Eventually our discussion turns to the NFL, as we look at the longest field goals ever kicked. Until this past weekend, 3 kickers shared the record at 63 yards. Two of those were kicked in Denver, and one was kicked in New Orleans by Tom Dempsey in 1970. I actually show them a YouTube video of Dempsey's kick. Keep in mind that New Orleans is below sea level. This past Sunday, December 8, Matt Prater kicked a NFL record 64-yard field goal in Denver. It is a huge advantage to kick in Denver because of the elevation - but Prater did kick his field goal on a cold day.
What about baseball?
The same principles apply to the flight of a baseball, so Denver's Coors field is a favorite among home-run hitters. By some estimates a baseball will travel 30 feet farther in Denver (compared to sea level). Try this interactive home run simulator see how altitude affects the distance a baseball will travel.
So what about humidity?
Water molecules are less massive than the nitrogen and oxygen molecules they replace, so collisions with water molecules have less influence on the flight of the ball. However, in baseball the balls actually absorb moisture in humid conditions, which makes them a bit heavier - and more importantly it makes them a little softer (less bouncy). In fact baseballs used at Coors Field are actually stored in a humidor to soften them up and counter the affect high altitude. To learn more about the humidor and the situation at Coors Field (including a really good PowerPoint presentation), CLICK HERE. I've often wondered whether the humidity in New Orleans helped or hindered Dempsey's historic kick in 1970.
To view a convenient list of all the resources that have been posted on this "Earth Science Guy" blog site, CLICK HERE.
Friday, December 6, 2013
NWS Summary of November 17 Tornado Outbreak

Thursday, November 28, 2013
Friday, November 22, 2013
Solar Eclipse as Viewed From Geostationary Satellite

To view a convenient list of all the resources that have been posted on this "Earth Science Guy" blog site, CLICK HERE.
Thursday, November 14, 2013
Typhoon Haiyan - Interactive Before and After Photos + Two Videos

Also, check out this animation of a storm surge from NOAA. - CLICK HERE
On a another note, this week's NOVA on PBS looks interesting - Asteroid: Doomsday or Payday
To view a convenient list of all the resources that have been posted on this "Earth Science Guy" blog site, CLICK HERE.
Thursday, November 7, 2013
A Great Example of Differential Weathering

See more photos from our October trip through the White Cliffs.
To view a convenient list of all the resources that have been posted on this "Earth Science Guy" blog site, CLICK HERE.
Thursday, October 31, 2013
Volcanic Eruption Viewed from Space Station

To view a convenient list of all the resources that have been posted on this "Earth Science Guy" blog site, CLICK HERE.
Friday, October 25, 2013
Hommocks Earth Science Department Resources
The Hommocks Middle School (Larchmont, NY) Earth Science Department has put together an impressive collection of resources to help students prepare for the the New York Regents Earth Science Exam. I especially like the animations. Here are a couple good ones that I found on their site.
Mid-Latitude Cyclone Animation
There are many more. Here is the link to their site: www.hmxearthscience.com Thanks to Mr. Wing, Mr. Goldstein, Mr. Frantzis, and Mr. Sammartano!
To view a convenient list of all the resources that have been posted on this "Earth Science Guy" blog site, CLICK HERE.
Friday, October 18, 2013
50 Maps That Will Help You Make Sense of the World
CLICK HERE to view the maps. Many are related to Earth Science.
To view a convenient list of all the resources that have been posted on this "Earth Science Guy" blog site, CLICK HERE.
Friday, October 11, 2013
D-News Videos
This a GREAT collection of short videos from the Discovery Channel. Many of them are perfect for adolescents.
To view a convenient list of all the resources that have been posted on this "Earth Science Guy" blog site, CLICK HERE.
Friday, October 4, 2013
"Moving Heat" Interactive

To view a convenient list of all the resources that have been posted on this "Earth Science Guy" blog site, CLICK HERE.
Friday, September 27, 2013
Scary Geology Project Results in Impressive Visual

To map the geology of the cliff, Roger spent up to three days at a time on the face, sleeping on a tiny platform at night. During the day, he took rock samples and wrote detailed field notes. The project was supported by the National Geographic Society.
Photo courtesy of the Alpinist.com.
To view a convenient list of all the resources that have been posted on this "Earth Science Guy" blog site, CLICK HERE.
Friday, September 20, 2013
Colorado Flooding: Before and After Pictures

Here is another before and after interactive provided NASA. CLICK HERE to view it. Scroll down and select "view image comparison".
To view a convenient list of all the resources that have been posted on this "Earth Science Guy" blog site, CLICK HERE.
Friday, September 13, 2013
60-Second Adventures in Astronomy

To view a convenient list of all the resources that have been posted on this "Earth Science Guy" blog site, CLICK HERE.
Friday, September 6, 2013
Paleoclimate: A History of Change

To view a convenient list of all the resources that have been posted on this "Earth Science Guy" blog site, CLICK HERE.
Thursday, May 23, 2013
Solar System Bracelet
Constructing a Solar System Bracelet is a GREAT activity for students in grades 6-9. My ninth graders loved it! Explain how to make them, and then allow 40 minutes for construction. To learn how to make the bracelets CLICK HERE - site may not open on some mobile devices.
There is no question that making the bracelet makes students much more interested in the solar system, however (like most diagrams and models of the solar system) the bracelet does not accurately depict the sizes AND distances. So, it's important to set aside time to help students understand these. Start by asking students why it is so difficult to make a model of the solar system that accurately shows BOTH sizes and distances. Next, use the following tips to help them understand.
Reality Check
If you could shrink everything in the galaxy so the Sun is 1 cm in diameter (as it is on the bracelet) . . .
1. Jupiter would have a diameter of 1 mm (.1 cm) and would be 18 feet 4 inches away!
2. Earth would be the size of a speck of dust and would be 5 feet 4 inches away!
3. Alpha Centauri would be 180 miles away!
4. Betelgeuse would be over 12 feet in diameter!
5. Go to BUILD A SOLAR SYSTEM web site and enter 10 mm for the diameter of the Sun to learn about other sizes and distances. If you could shrink everything so that the Earth is ~4 mm in diameter (as it is on the bracelet), enter 450 mm for the Sun's diameter to find out how big and far away things would be.
6. Students often want to whether or not the planets will ever line up. The answer is "no". To see the current position of the planets, go to the SOLAR SYSTEM VIEWER web site. Enter "800-1000" for the "size", and then select "update".
7. For another fun interactive, check out the SOLAR SYSTEM VISUALIZER.
This will be the last post of the school year. Have a great summer! To view a convenient list of all the resources that have been posted on this "Earth Science Guy" blog site, CLICK HERE.
Friday, May 17, 2013
Interactive Eclipse Animation

Check out this slick tool from McGraw-Hill. CLICK HERE to try it out. Be sure to check out the "Exercises".
To view NASA's Eclipse site, CLICK HERE.
Friday, May 3, 2013
Friday, April 26, 2013
World's Largest Erratic is Part of Foothills Erratic Train

The Okotoks Erratic (a.k.a. Big Rock) is the world's largest known glacial erratic. This huge piece(s) of quartzite sits on the Alberta prairie about 11 miles south of Calgary.
What's more interesting is that Big Rock is part of a long line of erratics strewn from Jasper National Park into northern Montana (see map below). Geologists believe the rocks were part of a rockslide that fell onto a glacier in the Tonquin Valley of Jasper Park and were carried by ice southward along the mountains. Apparently glaciers flowing from the Canadian Rockies out onto the prairie were turned southward as they converged with the Laurentide Ice Sheet (map). The band of rocks is know as the Foothills Erratics Train. To learn more about the Okotoks Erratic and read the Blackfoot story of how it broke into two pieces, CLICK HERE.
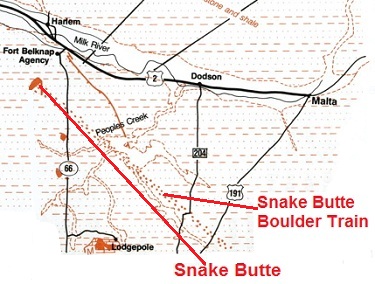
A similar (but much smaller) line of erratics, called the Snake Butte Boulder Train (map), can be found in north-central Montana on the Ft. Belknap Reservation (photo). To view a convenient list of all the resources that have been posted on this "Earth Science Guy" blog site, CLICK HERE.

Friday, April 19, 2013
Fifty Years from Now . . . Ending Overfishing
Ending Overfishing from OCEAN2012 on Vimeo.
This video was produced by Oceans2012.To view a convenient list of all the resources that have been posted on this "Earth Science Guy" blog site, CLICK HERE.
Friday, April 12, 2013
Rivers Like Shortcuts Too!

This Google Earth image shows several oxbow lakes near Kalispell, Montana. Watch this animation to see how a slow-moving, meandering river carves a broad valley over thousands of years. Be sure to click on the inset at the end of the animation to watch a second animation that shows how an oxbow lake forms. To learn more about the formation of oxbow lakes, CLICK HERE.
Friday, April 5, 2013

Friday, March 29, 2013

Friday, March 22, 2013
Catchy Animated Groundwater Cartoon
I like to show this short video right at the start of our study of groundwater. The video was produced for King County (Seattle). I ask my students why a county government would fund something like this. This leads into a short discussion of conservation and the ways that governments get their citizens to conserve various natural resources (laws, incentives, education).
CLICK HERE to see a better quality version of the video.
To view a convenient list of all the resources that have been posted on this "Earth Science Guy" blog site, CLICK HERE.
Friday, March 15, 2013
Introductory Puzzle Activities (geology)

Thanks to Nancy Young for recommending these two activities, which are both provided by the American Museum of Natural History. Both are "pdf" files that might be best used before you get into the topics. One is the Plate Tectonics Puzzle and the other is called Solve a Sedimentary Layers Puzzle.
To view a convenient list of all the resources that have been posted on this "Earth Science Guy" blog site, CLICK HERE.
Friday, March 8, 2013
What's All the Fuss about Fracking?
Chances are there is no mention of the word "fracking" in your curriculum. Nonetheless, students should know what it is and understand the pros and cons. This 4.5 minute video might generate some interest.
Here are three more resources related to fracking:
1. Interactive Tutorial from National Geographic
2. Bakken Oil Boom Visible From Space
To view a convenient list of all the resources that have been posted on this "Earth Science Guy" blog site, CLICK HERE.
Friday, March 1, 2013
A Montana Tsunami
Show this to your students and see if they can figure out what caused it. The Gallatin River joins with the Madison and the Jefferson near Three Forks, MT to form the Missouri River. To learn more about ice jams, CLICK HERE.
To view a convenient list of all the resources that have been posted on this "Earth Science Guy" blog site, CLICK HERE.
Friday, February 22, 2013
Visit a Montana Laccolith

This week's resource is a "virtual field trip" to a butte located in central Montana. Crown Butte is a laccolith that formed over 70 million years ago, and has been exposed by erosion. The butte and surrounding area feature examples of the following: columnar jointing, igneous rock in layers (layered igneous complex), a beautiful porphyry, lateral dikes, and a nearby extinct volcano. The photo on the right shows the porphyry that Crown Butte is made of. The large augite crystals formed before the molten rock moved from the magma chamber into the laccolith.
For a short preview, watch the PowerPoint presentation below, and then CLICK HERE to access the "virtual field trip". Here is the WORKSHEET (pdf file) that students will do as they use the web site. Another version of the worksheet is also available on the web site.
To view a convenient list of all the resources that have been posted on this "Earth Science Guy" blog site, CLICK HERE.
Friday, February 15, 2013
Videos that Impress and Educate
Update on the meteor that exploded over Russia: Watch this Video Segment from Saturday's ABC News.
Below: When it comes to greenhouse gases, methane is often overshadowed by carbon dioxide. Your students will remember methane after they see this 2-minute video. Be sure to watch the last 30 seconds!
Below: This is a segment from the documentary, "Chasing Ice", which I watched a couple weeks ago. I highly recommend that you see it on the big screen. The imagery is amazing!
To view a convenient list of all the resources that have been posted on this "Earth Science Guy" blog site, CLICK HERE.
Friday, February 8, 2013
Clever Density Demonstration from Steve Spangler
Anyone who teaches Earth science knows that density differences play an important role in many Earth systems. This (see video above) is one of the most clever demonstration of density that I've seen in quite some time. The mystery liquid is vegetable oil. Thanks to Rick Dees of Huntley Project High School for sharing it.
Coming on Friday, February 15 . . .
(unrelated to density) An asteroid, 50 m in diameter, will pass within 21,000 miles of Earth. Watch this 4-minute NASA Science Cast video to learn about the details.
One more thing . . .
This week's NOVA looks like it might be pretty good. The two-hour special, titled Earth from Space, airs Wednesday evening, February 13 on PBS.
To view a convenient list of all the resources that have been posted on this "Earth Science Guy" blog site, CLICK HERE.
Friday, February 1, 2013
Latent Heat Activity Provides "Eureka Moment"!
The first 3 minutes of this video show how to do the activity. The final 4 minutes are highlights of my students doing the activity. CLICK HERE to read the guidelines, and gain access to a PowerPoint and a student handout.
Hidden heat . . .
Most people understand that storms transport moisture from the oceans to continents. But, another important aspect of storms, often over-looked and not well-understood, is that they transport heat as well. It's easy to convince students that water molecules in those snow-flakes falling outside evaporated from the ocean a few days ago, however convincing them that storms transport heat is a tougher sell. Actually, the two (moisture and heat) are closely related. As water molecules evaporate from the ocean, they absorb heat in order to make the phase change. Then, as that vapor changes back into liquid droplets in a hurricane or ice crystals in a winter storm, this heat is released into the surrounding air. Called latent heat, this is the "energy" that fuels hurricanes and the warmth of Chinook winds, and it plays an important role in microbursts and other interesting things that happen in the real world.
Seeing is believing . . .
The best thing about this activity is that students actually get to watch the temperature of water rise dramatically as water freezes right before their eyes! They will use a beaker of salty slush to supercool (-5) two test tubes of water. Then they will "trigger" the freezing. As the water molecules change from liquid to ice (within seconds), they release latent heat. This causes the temperature of of thermometers in the water to rise (also within seconds). The show doesn't last long, but it is pretty cool to see the surprise on students' faces as they watch it happen.
To view a convenient list of all the resources that have been posted on this "Earth Science Guy" blog site, CLICK HERE.
Friday, January 25, 2013
SciShow Video: Can We Predict Earthquakes?
This 4-minute video explains the challenges of predicting earthquakes in the short-term.
To view a convenient list of all the resources that have been posted on this "Earth Science Guy" blog site, CLICK HERE.
Friday, January 18, 2013
A Model to Help Explain the Aurora Borealis

Many people think that sunlight reflecting off of ice at the poles causes the northern lights. This is not true! The true cause of the lights is a combination of three factors - the solar wind, Earth’s magnetic field, and the atmosphere.
The solar wind . . .
The sun is constantly emitting charged particles (electrons and positive ions). This invisible "wind" of particles, called plasma, varies in intensity depending on how active the sun has been. If there is some sort of flare or other type of "storm" on the sun, the solar wind becomes stronger.
Earth's magnetic field . . .
We are protected from the harmful effects of the solar wind by Earth's magnetic field. The magnetism of our planet forms an invisible shield represented by the blue lines (pipe cleaners) on the model above.
Earth's atmosphere . . .
As the solar wind encounters our magnetic field, the lines guide some of the charged particles down toward the Earth. As the particle enter our atmosphere, something similar to what happens in a fluorescent light bulb takes place. The charged particles "energize" gases in the atmosphere, causing them to emit light. The normal position of the auroral oval is far to the north of us. The city best positioned to see the light show may be Fairbanks, Alaska. As long as the night is dark and clear, there is a very good chance that residents of central Alaska will see the lights. A similar ring of light exists near the Magnetic South Pole (the southern lights; Aurora Australis).
So what does it take for us to see the lights in the "Lower 48"? . . .
In order for the oval to be present at lower latitudes, there must be some sort of storm on the sun. If such a storm causes a burst of solar wind (coronal mass ejection) this can disrupt Earth's magnetic field, causing those invisible lines of magnetism (blue lines on model) to enter the Earth much farther to the south of their normal position. This happens more often during a "solar maximum": a year when the sun is especially active. The last solar max occurred in 2001 and the next is expected in the Autumn of 2013.
To learn more, here are few more resources:
1. Aurora FAQs
2. Montana Earth Science Picture of the Week
3. The Solar Max is Coming!
4. Aurora Forecast Page
To view a convenient list of all the resources that have been posted on this "Earth Science Guy" blog site, CLICK HERE.
Friday, January 11, 2013
#132 - Special Conditions Needed for Rime to Form

I took these photos on the evening of January 22, 2024 at the outdoor basketball courts near Hays-Lodgepole High School. The high school is in Hays on the Ft. Belknap Reservation. That night the air in Hays met all the requirements needed to form an unusual kind of frost called "rime" (aka rime ice). The white, feathery ice crystals form when supercooled water droplets in fog freeze instantly upon contact with a surface that is also colder than the freezing point. There has to be a breeze too - The crystals build up in the direction of the wind is coming from, creating beautiful but heavy accumulations on objects like trees, wires, buildings . . . or basketball nets!
Recipe for Rime:
1. The microscopic fog droplets must be supercooled - colder than the freezing point, but still liquid. Not all fog is made of droplets that are supercooled.
2. There has to be a breeze pushing the air toward a surface.
3. The surface that the rime builds up on must also be below freezing. The supercooled droplets freeze on contact with cold surfaces, growing as the breeze pushes more droplets toward the surface.
Below: Rime crystals point into the wind on this chain-link fence.

Normal frost and dew form when the air temperature drops below the dew point. Dew points vary depending on the amount of humidity (water vapor) in the air. If there is a lot of vapor in the air, the dew point will be higher. Dew points in Montana are typically much lower than places like Florida. So for example, if the dew point is 37 degrees and the temperature drops to 35 degrees that night, dew will form as water condenses on surfaces. However, if the dew point is 29 degrees and the temperature drops to 27 that night, it will be frost that forms (because the dew point was below the freezing temperature). Frost forms as vapor changes directly to solid - called deposition. When the Sun comes up the next morning the temperature may rise above the dew point, evaporating the dew or changing the frost back to vapor (called sublimation).
Term: sublimation, supercooled
Below: Here is the freezing fog that was responsible for the rime. Students call these outdoor courts "Four Courts" or "4C" for short.

Friday, January 4, 2013
"The Day the Mesozoic Died" - Free Video is Excellent!

The video focuses on geologic clues that led to acceptance of the theory that an asteroid impact killed of the dinosaurs. I ordered the video and plan to use it after my students learn how geologists interpret rock layers (superposition, cross-cutting, inclusions, etc.)
The HHMI site also provides several classroom ready resources to complement the video, including a quiz, as well as teacher guidelines and student handouts for several activities. To access those, CLICK HERE.
Learn more about the impact theory here: K-T Boundary in Montana
To view a convenient list of all the resources that have been posted on this "Earth Science Guy" blog site, CLICK HERE.
Subscribe to:
Posts (Atom)